
Read time: 3 minutes
Today I’m going to show you how to quickly start monitoring your ASP.NET Core application in Azure.
Having good monitoring in place is a huge life saver since it can quickly give you a good insight into the health of your application and works as the pillar upon which you can later setup alerts to make sure you know about application problems before your customers ever notice.
Many folks leave monitoring for the very end, which is not surprising since it’s not critical to get the app up and running and the traditional series of concepts to learn, libraries to install and services to configure, can be overwhelming.
You need to start monitoring to your .NET application today.
I’ll show you how to start collecting metrics using OpenTelemetry, a super popular observability framework to collect, process and export telemetry data and the Azure Monitor OpenTelemetry Distro, a new library to make it really easy to publish collected metrics to Azure Monitor Application Insights.
With these two sets of frameworks in place you’ll be able to:
- Add basic monitoring to your ASP.NET Core app in no time
- Quickly see your app’s basic health indicators in your Azure Portal
- Start tracking your custom metrics with a few lines of code
Here’s how to get started, step by step:
Prerequisites
- An Azure subscription. You can sign up for a free trial here.
- Your existing ASP.NET Core application. I’m not sure how much you’ll be able to do with other types of .NET apps.
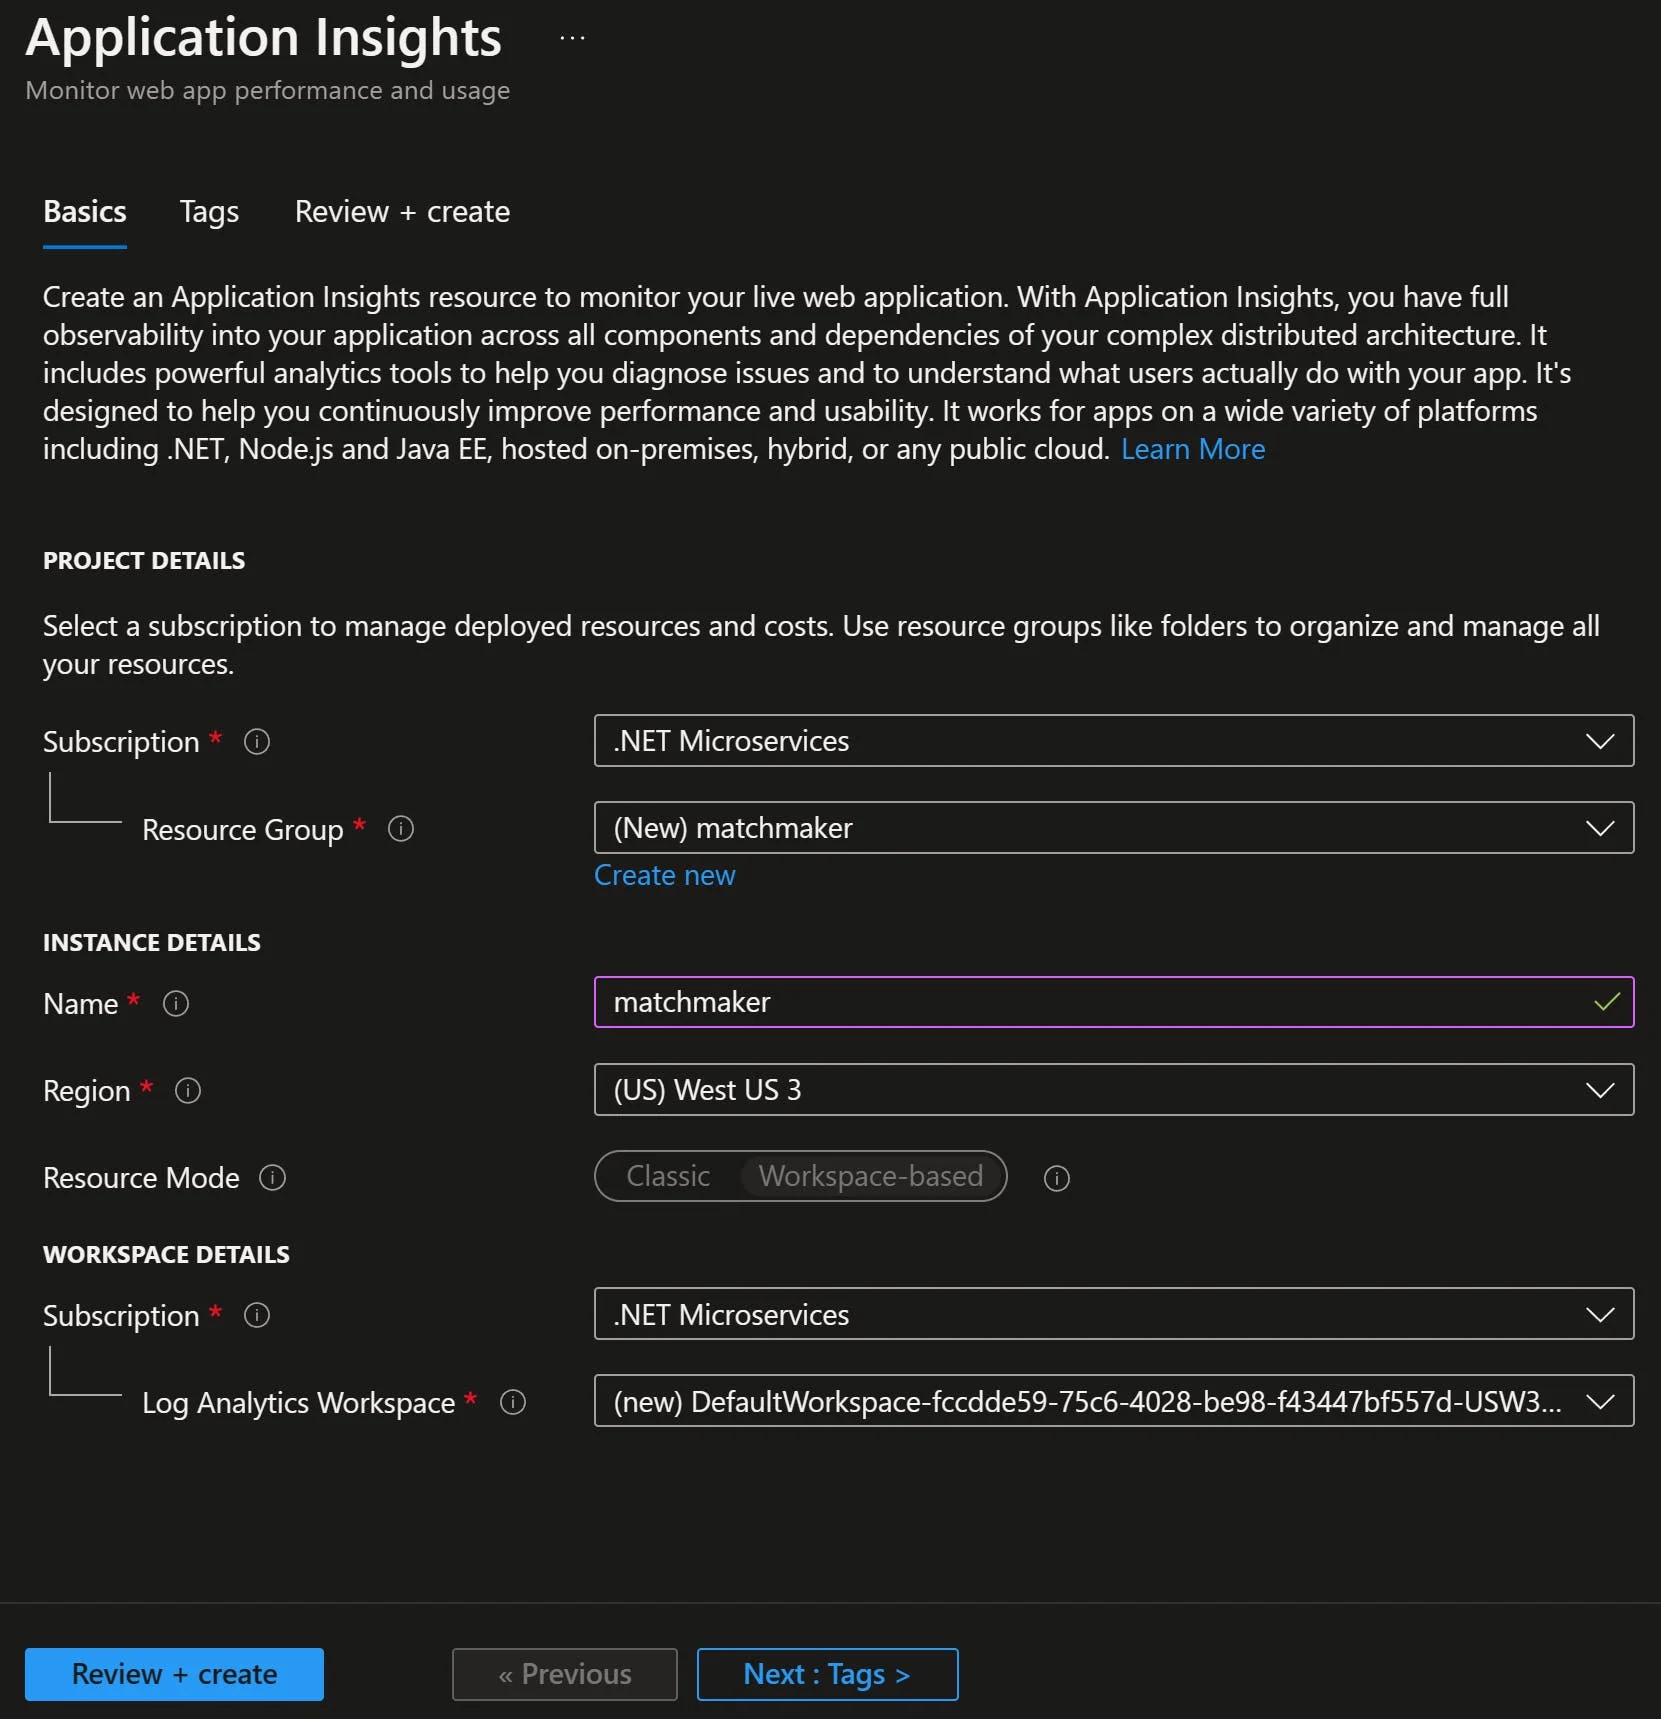
1. Create an Application Insights resource
In your Azure Portal, look for the Application Insights service and create a new one:
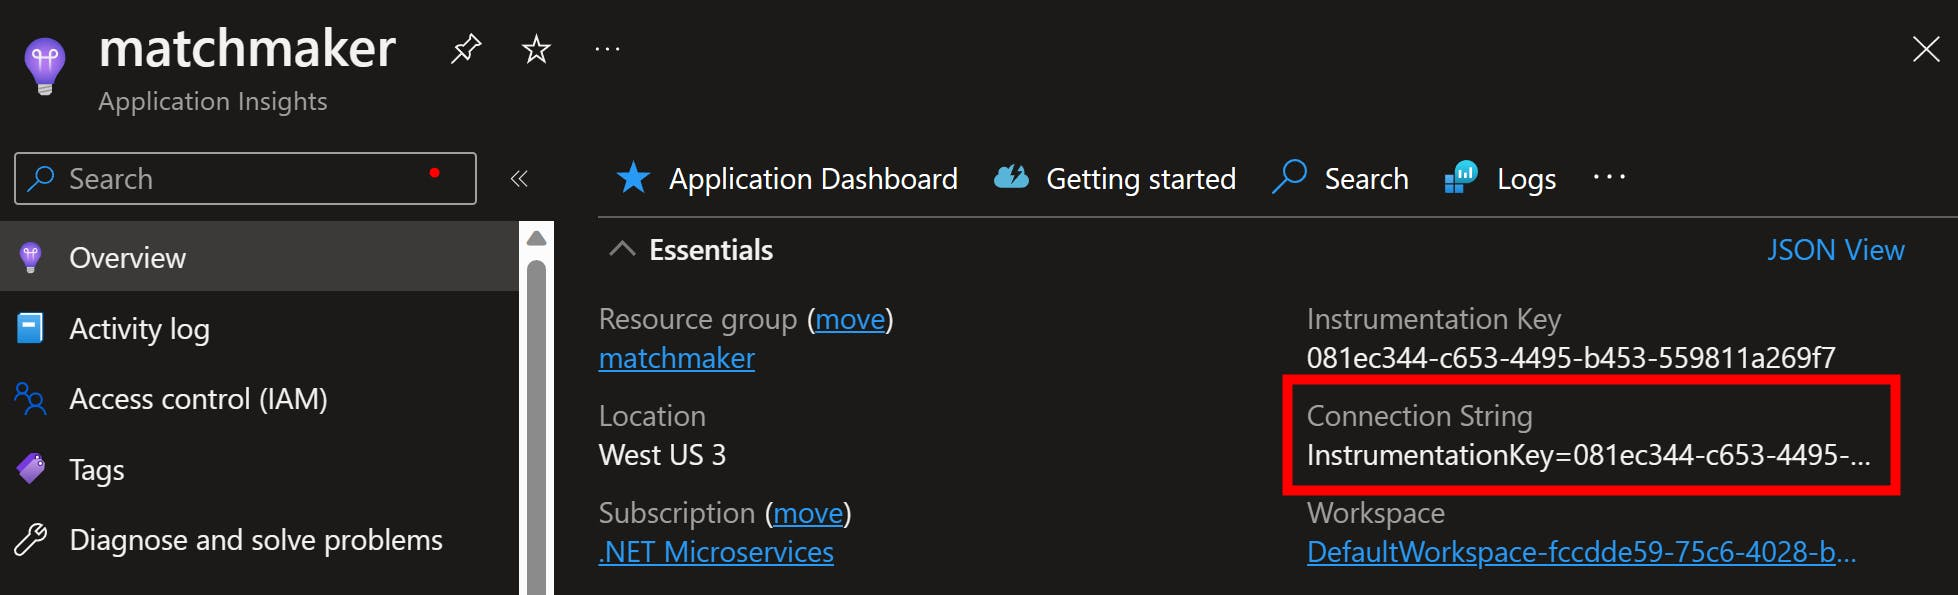
Once creation is completed (20-30 seconds in my case), go to your new App Insights resource and copy the connection string that you’ll find in the Overview blade. You’ll need that later.
2. Install the client library
Open a Terminal, switch to your ASP.NET Core app dir and install the Azure Monitor OpenTelemetry Distro client library:
dotnet add package --prerelease Azure.Monitor.OpenTelemetry.AspNetCore
3. Register the Azure Monitor OpenTelemetry services
Add the following line to your Program.cs file:
builder.Services.AddOpenTelemetry().UseAzureMonitor();
That will both register the OpenTelemetry services and configure Azure Monitor exporters for logging, distributed tracing and metrics. The simplest Program.cs file would look like this now:
var builder = WebApplication.CreateBuilder(args);

builder.Services.AddOpenTelemetry().UseAzureMonitor();

var app = builder.Build();

app.Run();
4. Provide the App Insights connection string to your app
For your app to start talking to Azure App Insights, it needs the connection string you copied earlier. There are a few ways to configure the connection string in your app, but for local development purposes my preferred approach is to use the .NET Secret Manager.
To do that, first go back to your Terminal and initialize user secrets for your app:
dotnet user-secrets init
Then, set your secret, where the key must be AzureMonitor:ConnectionString and the value the actual connection string:
dotnet user-secrets set "AzureMonitor:ConnectionString" "YOUR CONN STRING HERE"
5. Confirm your app is sending data to Azure App Insights
Surprisingly, there’s nothing else to do to start getting data in App Insights. So, start your app and start hitting a few of your endpoints to start collecting monitoring data.
Give it a few minutes (data will not show up in real time in Azure) and eventually you should see a few essential metrics popping up in your App Insights Overview blade:
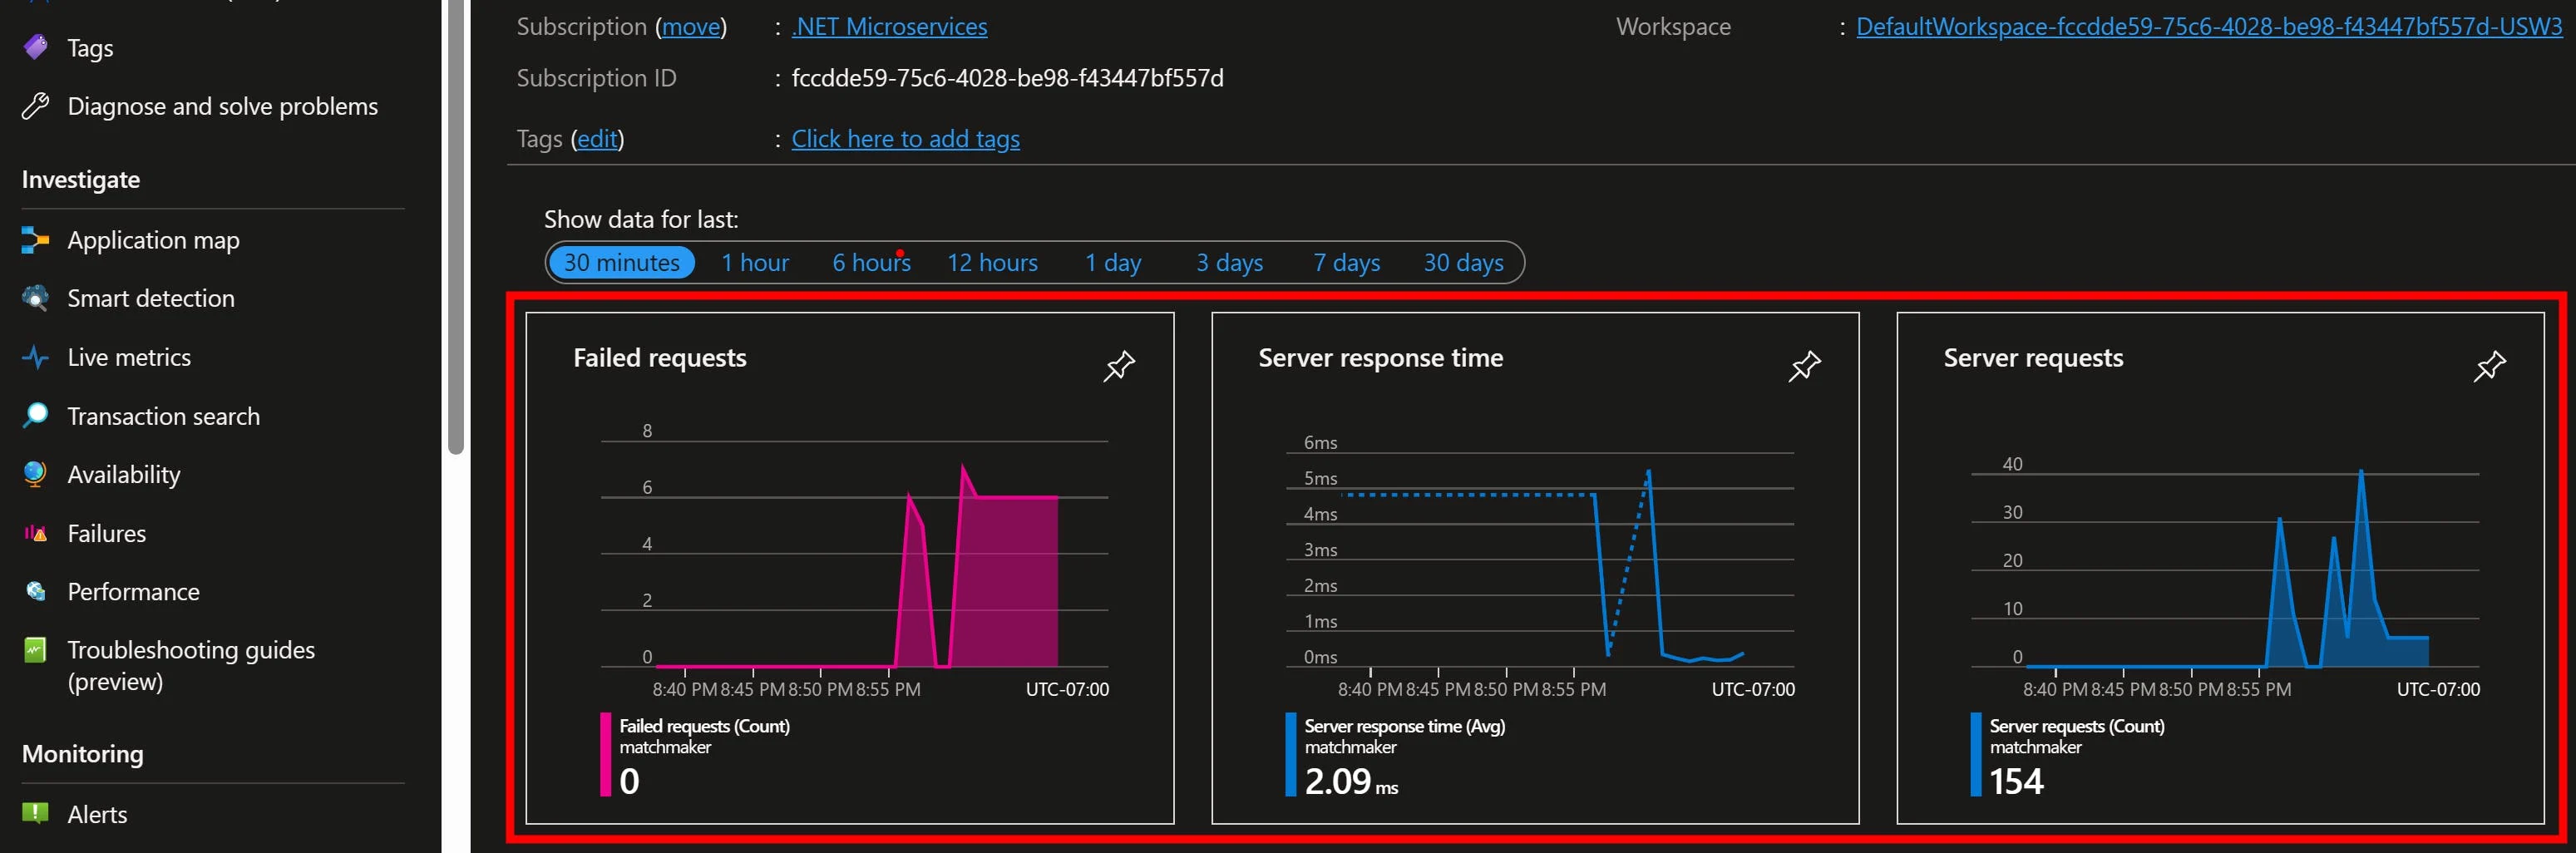
I even tried out a few requests that resulted in a 404 to confirm they would show up as failed requests in the first chart.
6. Track custom metrics
Let’s say that now you want to start tracking your own metrics. For instance, in my little Match Making app I’d like to start counting each time a new match is created and report that as a new metric.
That’s actually quite easy with the built in APIs provided in .NET. So here’s what you do:
-
Define a counter:
private readonly Counter<int> matchesCreatedCounter; -
Create an instance of the meter for your API and use it to create your counter:
Meter meter = new("MatchMaker.Api"); matchesCreatedCounter = meter.CreateCounter<int>("matches_created"); -
Count! For instance, here’s where my app creates a new match, so just after the match is created in my repository, I use the counter to count one more match created:
if (match is null) { // Create a new match match = new GameMatch() { Id = Guid.NewGuid(), Player1 = playerId, State = GameMatchState.WaitingForOpponent }; await repository.CreateMatchAsync(match); matchesCreatedCounter.Add(1); } -
Define your new meter in your Program.cs via the ConfigureOpenTelemetryMeterProvider method:
builder.Services.ConfigureOpenTelemetryMeterProvider((sp, builder) => builder.AddMeter("MatchMaker.Api")); -
Run your app and execute the endpoint(s) that use the above logic. Then go to your Metrics blade in the Azure portal and add your new metric. In my case, the created matches look like this:
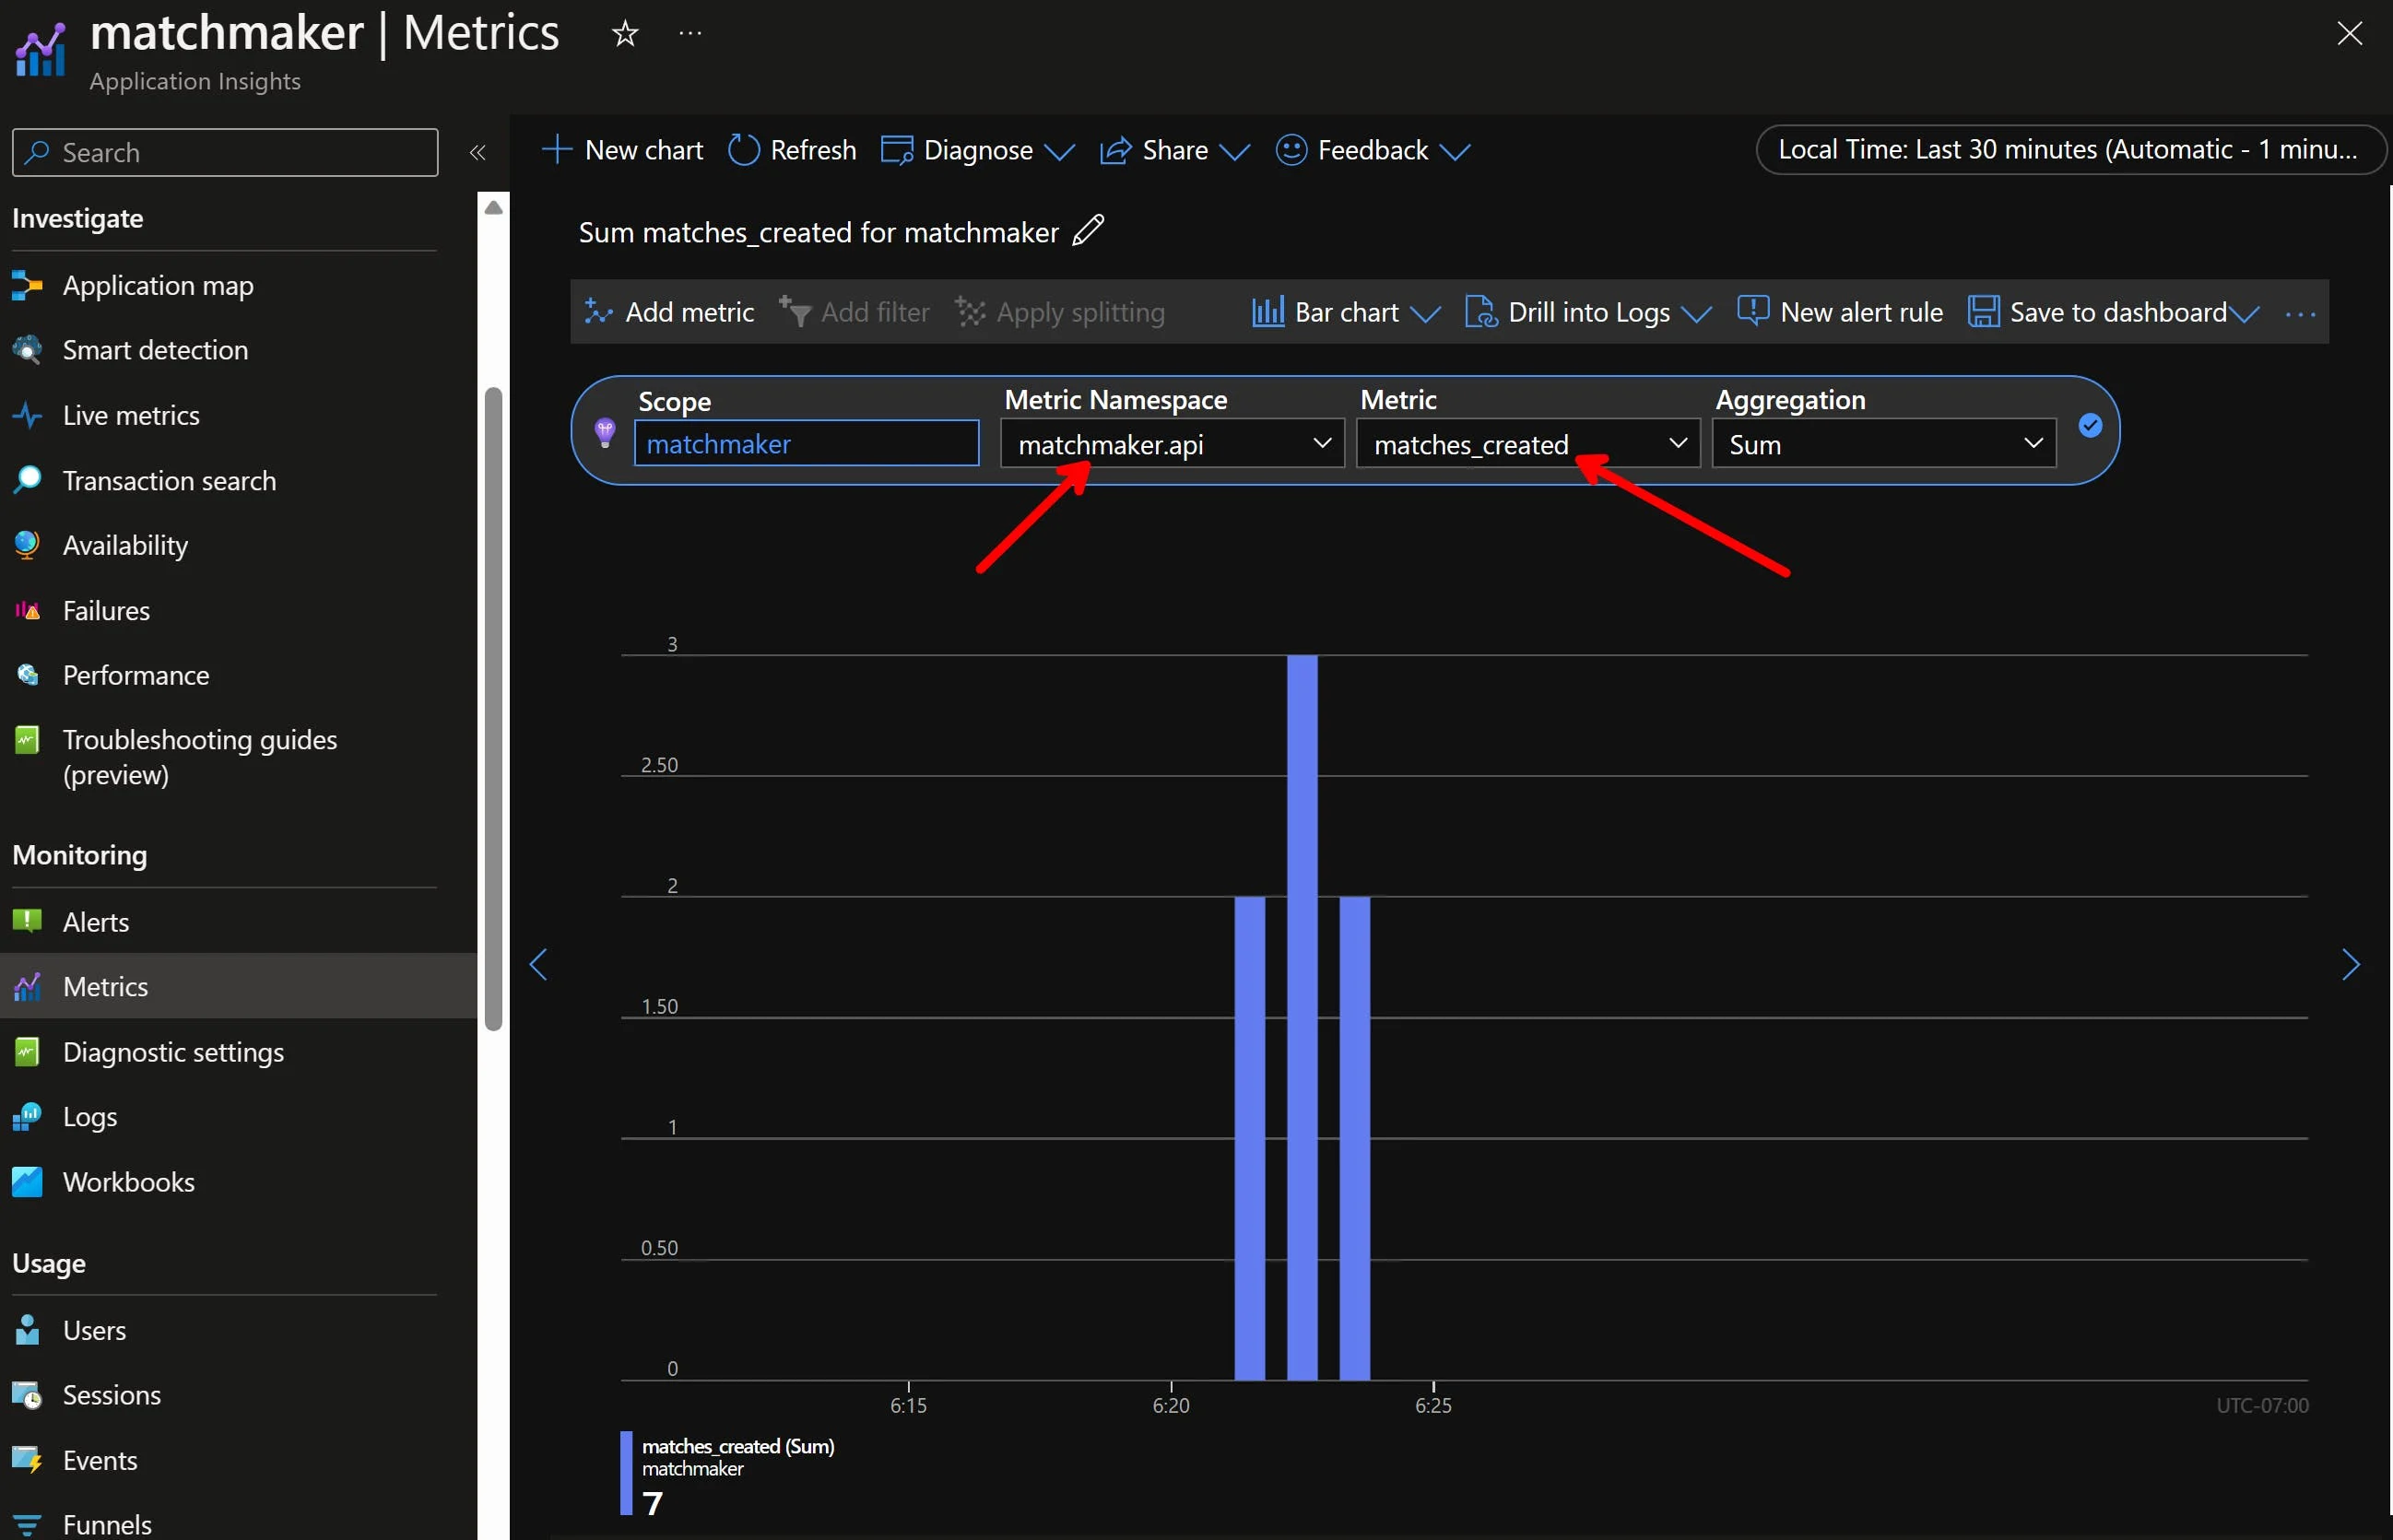
Done!
Well, that’s it for today.
I hope you enjoyed it.
Whenever you’re ready, there are 3 ways I can help you:
-
Building Microservices With .NET: The only .NET backend development training program that you need to become a Senior C# Backend Developer.
-
ASP.NET Core Full Stack Bundle: A carefully crafted package to kickstart your career as an ASP.NET Core Full Stack Developer, step by step.
-
Promote yourself to 15,000+ subscribers by sponsoring this newsletter.